How to find your best sub-categories of products that make up 80% of total sales?
Pareto 80/20 calculation using WINDOW function in Power BI
Identify the most profitable product sub-categories using the 80/20 rule in Power BI ?
In this article I want to show you how to find the product sub-categories that generate 80% of total sales. This is equivalent to the application of Pareto's principle.
The Pareto principle can be very relevant in a business context, for example to determine which products, customers, suppliers, regions,... make up 80% of overall sales.
We need to create DAX measures to find out which product sub-categories generate 80% of total sales.
To do this, I used the "WINDOW" function. I have always appreciated this new DAX function, recently added as part of the December 2022 Power BI updates. It is very useful to facilitate the running totals calculation in Power BI.
👇Find my blog post presenting this function:
The implementation of Pareto calculation in Power BI is a good example to leverage the capabilities of the “WINDOW” function.
For that I created two mesures:
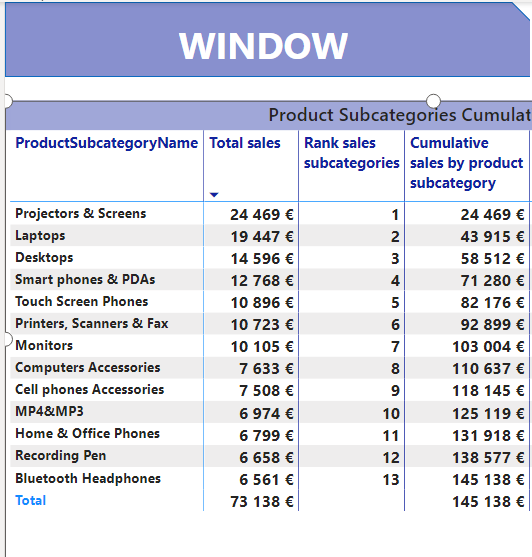
The cumulative sales by product sub-categories
The pourcentage of cumulative Sales
Cumulative Sales using WINDOW function:
The first DAX calculation "Cumulative sales by product sub-category" is used to calculate the running total of sales for each sub category product ranked in descending order.
Cumulative sales by product subcategory =

SUMX(

 WINDOW( 1 , ABS ,
         0 , REL ,
        ALLSELECTED ( 'dimProduct'[ProductSubcategoryName]),                       ORDERBY ( [Total sales], DESC )),

[Total sales])
In the WINDOW function created to generate the cumulative sales, I have added these parameters:
From position - Type: (1 - ABS): to create a list of product subcategories that starts at the first absolute position of 1 from the sub-categories products sales list.
To position - Type: (0 - REL): to specify that the end of the mentioned sub-product range is always set to the current position of the sub-category.
Relation: A table expression from which the output row is returned, corresponding to the sub-categories sales list.
OrderBy: to define how each partition is sorted. In my case, in order to apply the Pareto calculation correctly, I need to order the total sales to sort the sub-categories of the mentioned range in descending order.
Then I applied the SUMX function which allows us to iterate over each sub-category sales.
Percentage of cumulative sales.
We now need to determine the percentage of total running sales over the grand total sales. To do this, I divided the cumulative sales, previously calculated using the WINDOW function, by the total sales of all sub-categories.
 % cumulative Sales subcategories products =

VAR TotalSales = CALCULATE([Total sales],                              ALLSELECTED ('dimProduct'[ProductSubcategoryName]))

VAR CumulativeSalesDESC = [Cumulative sales by product subcategory]

 RETURN
 DIVIDE(CumulativeSalesDESC , TotalSales)
Thanks to the descending order of sales, we have obtained the product sub-categories that generate 80% of sales.
Find other sources that cover the same topic :


