Exploring WINDOW DAX function
I enjoyed testing the new WINDOW DAX function in Power BI with different use cases.
In this blog, I will share with you some use cases of the WINDOW function announced in the December 2022 updates of Power BI .
I tested the new OFFSET and INDEX functions 👉here
So lets start by introducing the WINDOW function: it allows us to perform calculations based on ranges, and retrieve a slice of results using absolute or relative positioning => so helpful for calculations like a Moving Average or a Running Sum.
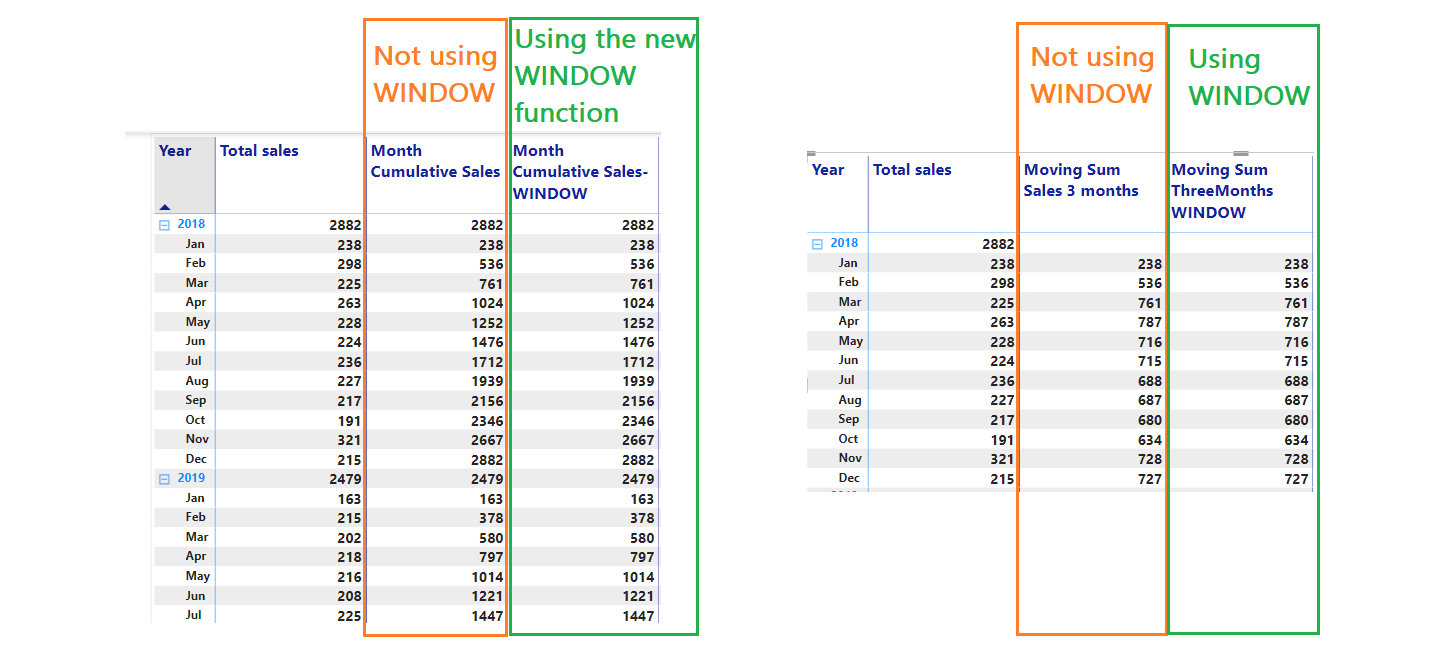
In order to illustrate this, I tested in a first example a month running calculation, and in a second example, a moving sales over three months, using both a standard DAX calculation method and a calculation including the new WINDOW function.
Calculate Month running sales with basic method:
Here my goal was to write a DAX measure that shows the yearly cumulative sales by month (= the month running total sales).
Here is the simple way to calculate a cumulative measure with DAX:
Month Cumulative Sales =
var actual_date=max(dimDate[Date])
return
CALCULATE([Total sales modified],
FILTER ( ALL ( dimDate[Date]), DimDate[Date] <= actual_date && YEAR(dimDate[Date])= YEAR(actual_date)))
Calculate Month running sales using WINDOW function:
Another way to have the same result using the new WINDOW function
Month Cumulative Sales- WINDOW =
CALCULATE([Total sales ],
WINDOW( 1,abs, //The first row in the partition
0,REL, // the current relative row in the partition
ALLSELECTED(dimDate[Year],dimDate[Month],dimDate[MonthNo]),
ORDERBY(dimDate[Year],ASC,dimDate[MonthNo],ASC),KEEP,
PARTITIONBY(dimDate[Year])))
Within the WINDOW function we need to indicate
From position: the number of rows to go back or forwards from the current row
From Type: ABS= absolute or REL=relative
To= the last row in the window
To Type: ABS= absolute or REL=relative
0, REL=> indicates each current row
1, ABS => indicates the first row in the partition
-1, ABS => indicates the last row in the partition
Relation: A table expression from which the output row is returned.
OrderBy: define how each partition is sorted
PartionBy: how the table expression is partitioned
Note: In my example my [Month] column is sorted by the [Month No] column in the “dimDate” table, that’s why I included it inside the the measure.
I have obtained the same results with the two approches:
Calculate Total Moving sales over three months using the standard method:
In my tested example, I wanted to add a rolling total sales for the last three months, including the current. For example, for March 2018, I expected the result to be the sum of sales including January, February and March 2018 .
Moving Sum Sales 3 months =
SUMX( DATESINPERIOD (dimDate[Date], LASTDATE(dimDate[Date]), -3, MONTH),
[Total sales]))
Calculate Total Moving sales over three months using WINDOW function:
Here I have used the WINDOW function to create partitions by year, in order to operate with the months within each partition, I have picked two previous months, up to the current month in each range to calculate the rolling sum of sales for 3 months back.
It calculates the total sales over three months, including the current month.
The first parameter of the WINDOW function is set to -2, so the range starts from two months before to the current month.
The end of the range is inclusive and set to 0 relative = the current month.


