Analyze SQL queries generated by a Power BI DirectQuery Dataset

When we use #DirectQuery mode for some tables in our #PowerBI reports, it will be interesting to see how #DirectQuery works behind the scenes, in order to improve report performance.
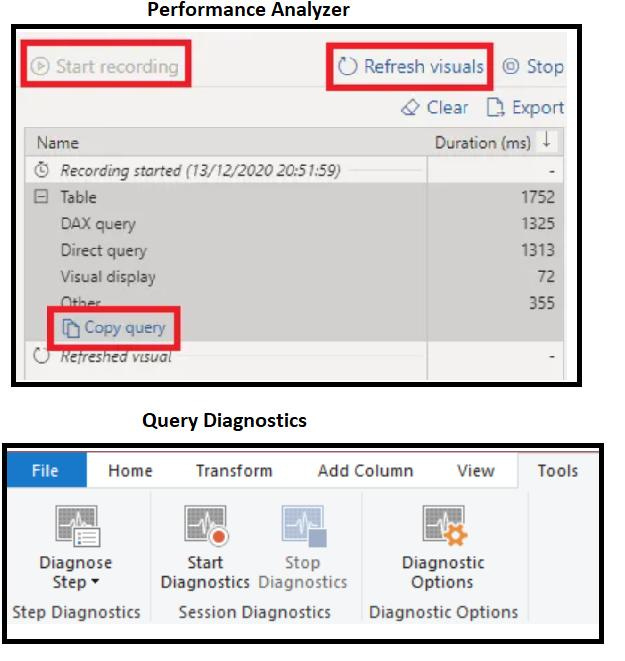
For example we need to see the SQL queries that are generated by Power BI when a report is run => we can view them in the tool for the data source itself, using #SQL_Server_Profiler for SQL Server, or we can also capture the SQL queries in #PowerBiDesktop using the #Performance_Analyzer (more details in my last post)
We need to start the Performance Analyzer, refresh visuals within the report and it will generate events corresponding to the visuals whose queries we want to visualize.
For other #DirectQuery data sources, we can use the #QueryDiagnostic feature available in the Power Query Editor.
For that we open Power Query, we go to the Tools tab on the ribbon, click the "Start Diagnostics" button, refresh the visuals, and then click the "Stop Diagnostics" button. We will then see many new queries appear in the Power Query editor that contain diagnostic data. We can navigate to the "Diagnostics_Details" query and display the details of the generated SQL that is sent to the data source.